How to combine sales and forecast data in Excel chart

Showcase actual vs targets in an Excel chart by following these quick and easy steps! Combine data to highlight your success.

Did you outperform during the last months and want to highlight it? Maybe your client sold more products than expected thanks to you? Or you exceeded your targets?

Impress your boss with your Excel skills and showcase your great results with unique bar charts. Learn how to combine sales and forecast data in the same bar chart and how to custom it.

Continue to read to learn how to create bar charts in Excel.

Ready to learn?

First, let start by creating a bar chart to showcase actual vs targets in Excel.

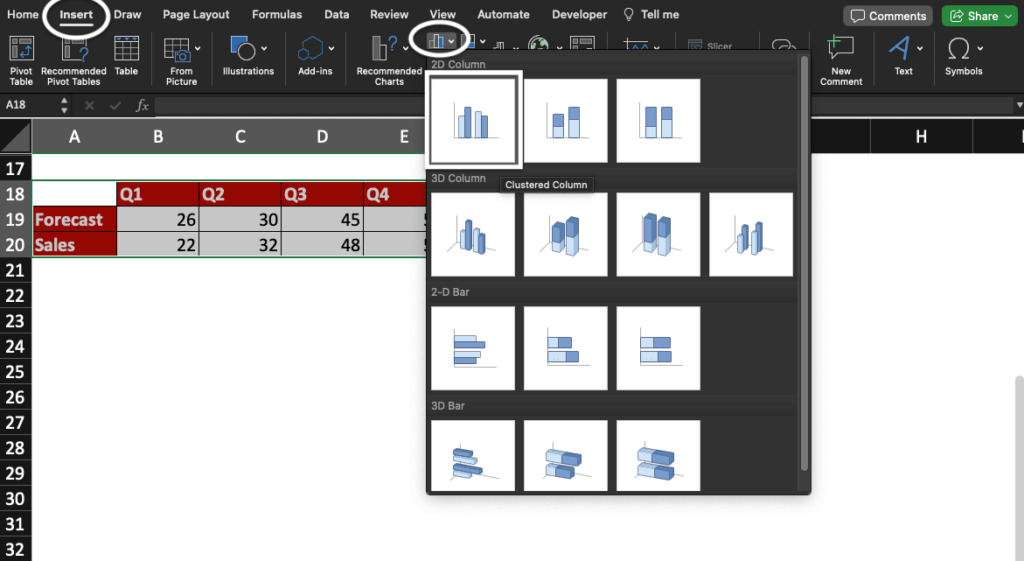
Select your table then go to Insert and click the Column icon to create a bar chart. In this example, let choose the first 2D clustered column chart.
You now have a bar chart created by the system that looks like this.

Time to add a secondary axis to combine sales and forecast data in an efficient format!

Adding a secondary axis helps you selecting more easily elements in the chart.
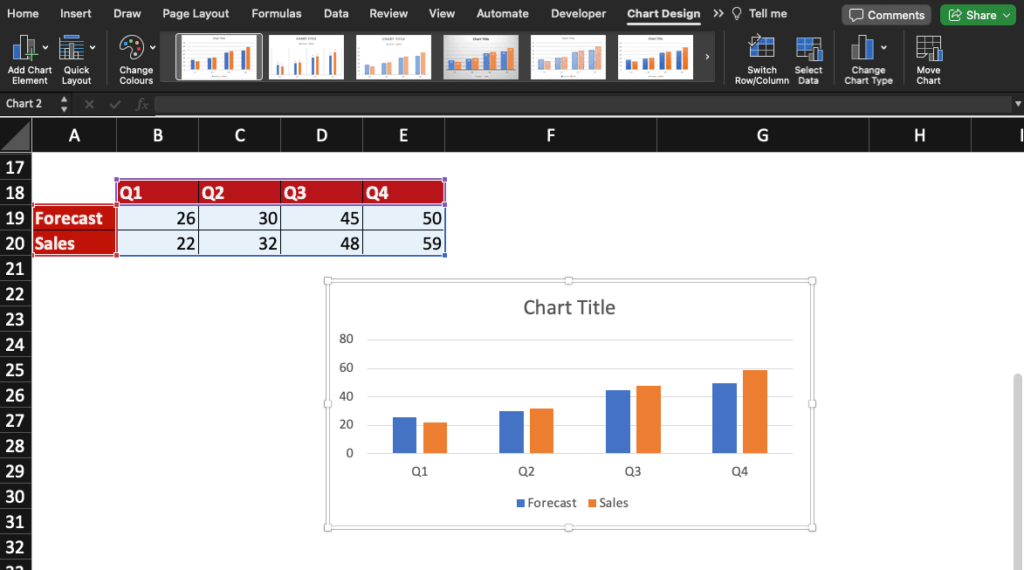
Add a secondary axis in your chart by double-clicking a Sales bar: the Format Data Series window will appear.

Then select Secondary Axis and change the Gap Width for the Sales bars to be slightly thinner than the Forecast ones.

Now that you have inserted a bar chart and have added a custom secondary axis, let customise the bar shape and finish customising our graph.

Customising charts can make your data easier to read and may impress your audience.

Choose the shape you want to use to make your data stand out then format it if needed. Change its colour, add shadow, etc.

If you don’t know how to change shapes in Excel column charts, click here to access our tutorial.
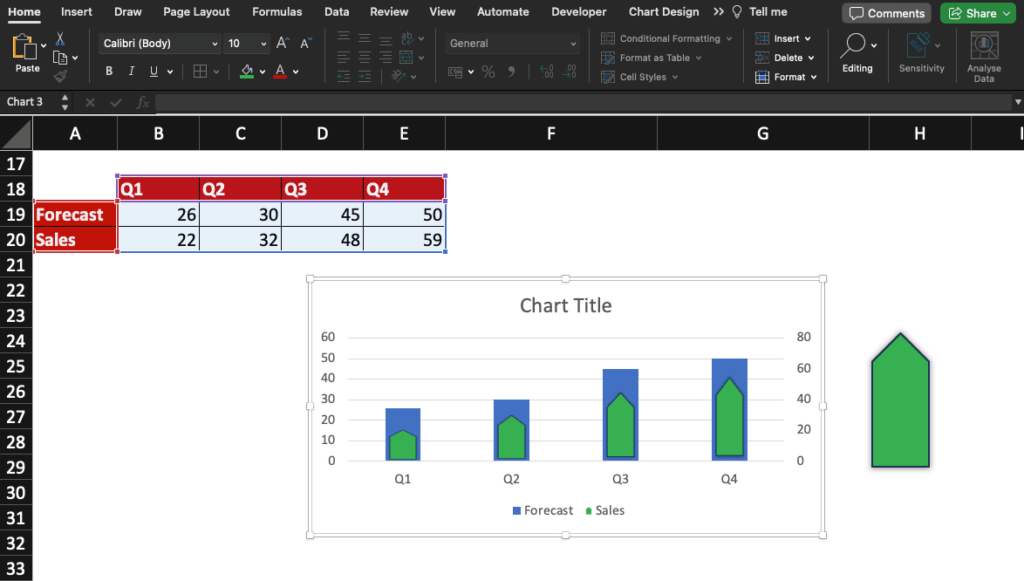
You created an Excel bar chart, added a secondary axis, customised the columns with a shape of your choice: you are ready for the next and final steps!

Now, let remove one of the axis to combine sales and forecast data in your chart.

To do so, click the axis you wish to delete ad press the delete key on your keyboard.
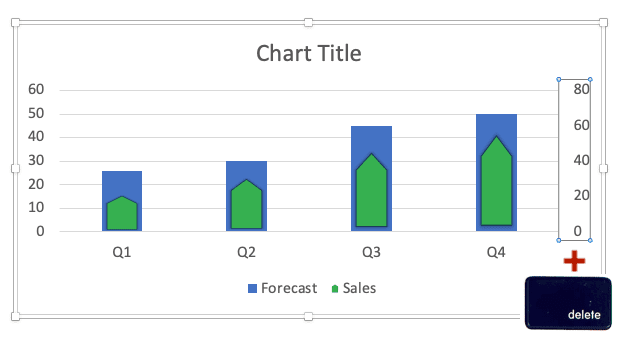
You may need to readjust the axis values like in this example. Indeed, some values in Sales and in Forecast are close and it’s difficult to differentiate them.

To do so, double-click the axis to open the Format Axis window.
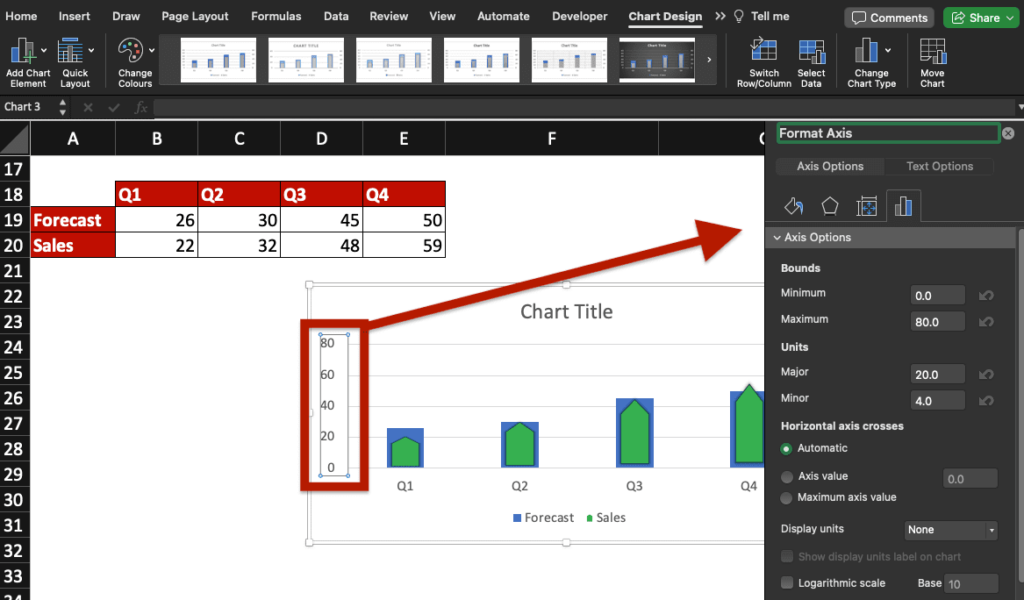
Modify the axis bounds and units, delete the chart title (select it then press the delete key) and add the Sales values on the chart for clarity.

Check this Excel bar chart with sales and forecast data combined!
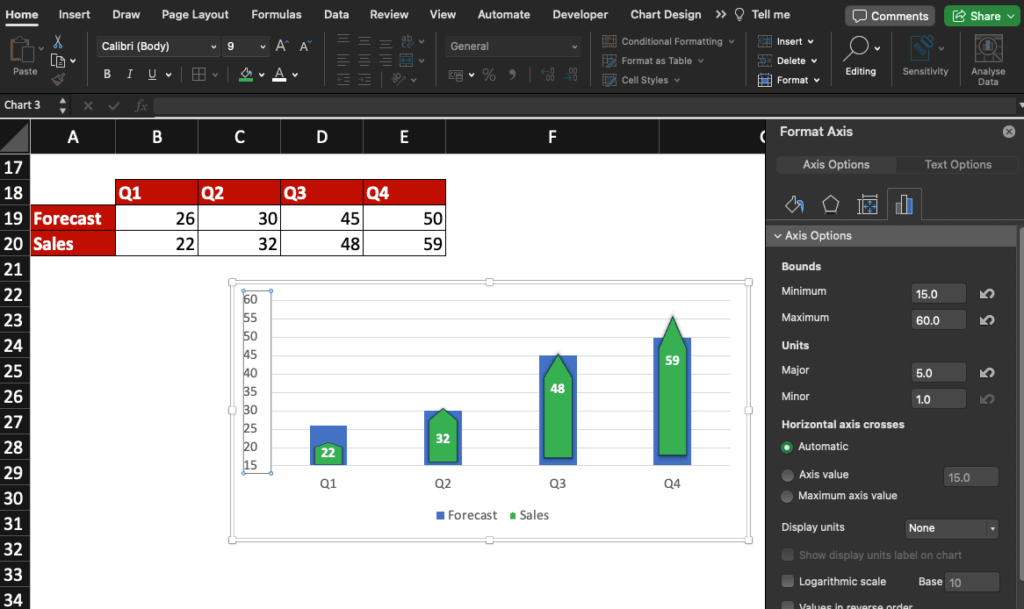
Now, you know how to create a bar chart in Excel and how to customise it in order to combine sales and forecast data like a pro.

Ready to take a step further? Join our Online Excel Course and get certified!

Advertising
Analytics

Categories

AllAdvertisingFormatsPlatformsKPI'sAd News

What is O&O Advertising?

Discover one more important jargon term used in Programmatic Advertising: O&O advertising. Get familiar with O&O formats and advantages.

Read More

Best DSPs for Programmatic Advertising

Ted Jordan shares his list of best DSPs for Programmatic Advertising so you don’t have to lose time searching the internet to find the right Demand-Side Platform for your campaigns.

Read More
What is Programmatic Advertising?

What is Programmatic Advertising?

Understand what programmatic advertising is and how it works to increase your ROI and become a specialist. Go from programmatic dummy to programmatic expert.

Read More
Programmatic Advertising: What is a SSP?

Supply-Side Platforms (SSPs) Explained

SSPs basics in advertising: learn what Supply-Side Platforms are used for and who use them. Get familiar with more programmatic advertising technical terms.

Read More
Programmatic Advertising: What is a DSP?

What are DSPs?

A DSP is a great tool to use but what does DSP stand for in marketing? What are some Demand-Side Platforms examples? Today, we answer your questions!

Read More

Programmatic Acronyms: 44 Terms to Know

Learn what these 44 Programmatic Advertising acronyms mean to understand what your colleagues or customers are saying when they use it. Explained with simple words, by Ted Jordan, for Digital...

Read More

Categories

AllFunctionsToolsShortcut Keys
Split Semicolon Separated Value in Excel

How to split semicolon separated values in Excel

Split semicolon separated values in Excel into columns and rows, or convert columns to semicolon separated values, like an Excel Master!

Read More

How to change shapes in Excel column charts

Learn how to easily change the columns shape in your Excel charts so your colleagues and customers will remember your impacting graphs.

Read More

How to use the LEFT, RIGHT and MID functions

Learn how to extract text in Excel with the LEFT, RIGHT and MID functions. Plenty of examples to learn from and functions are explained with simple words. If you start...

Read More
Absolute Referencing in Excel

Locking cells: what’s the Excel dollar sign shortcut?

The Excel absolute reference shortcut will become one of your favourites to save time! Switch from relative to absolute references in seconds using this trick.

Read More
Using Text to Column to Extract texts on Excel

Excel: How to split text into columns

If you need to extract data in Excel, you may want to use the Text to Columns tool. With only 3 steps, it's really easy to split text into columns.

Read More

Excel IF statement: how to use it for 3 conditions

Learn how to use the Excel IF statement with multiple conditions and combine it with OR and/or AND functions!

Read More